2026 Peptide & GLP-1 Clinic Intelligence Report

Grow Your Peptide Practice
With Data, Not Guesswork

Do you want to know exactly where your menu, pricing, and marketing stand in the national peptide market? We built the only market intelligence report from 846 verified peptide clinic menus, 2,905 advertised prices, and a signal-by-signal analysis of 807 clinic websites — designed exclusively for peptide and GLP-1 practitioners.

$299
One-time · lifetime access
Get Instant Access →
846
Verified clinic menus analyzed, all 50 states
2,905
Advertised prices benchmarked across compounds
807
Clinic websites analyzed for marketing & conversion signals
57%
Of clinics carry a compound the FDA just voted on — is your menu exposed?
🔒 Secure checkout
🔑 Access delivered within 2 hours
📊 Real advertised prices, not estimates
🗺️ All 50 states covered
🔄 Data collected July 2026
Sneak peek

This is just the top of the Summary tab.

There are 9 more sections like this — each with its own data set, benchmarks, and action plan. Here's a taste of what's waiting inside.

peptide-clinic-intelligence.netlify.app
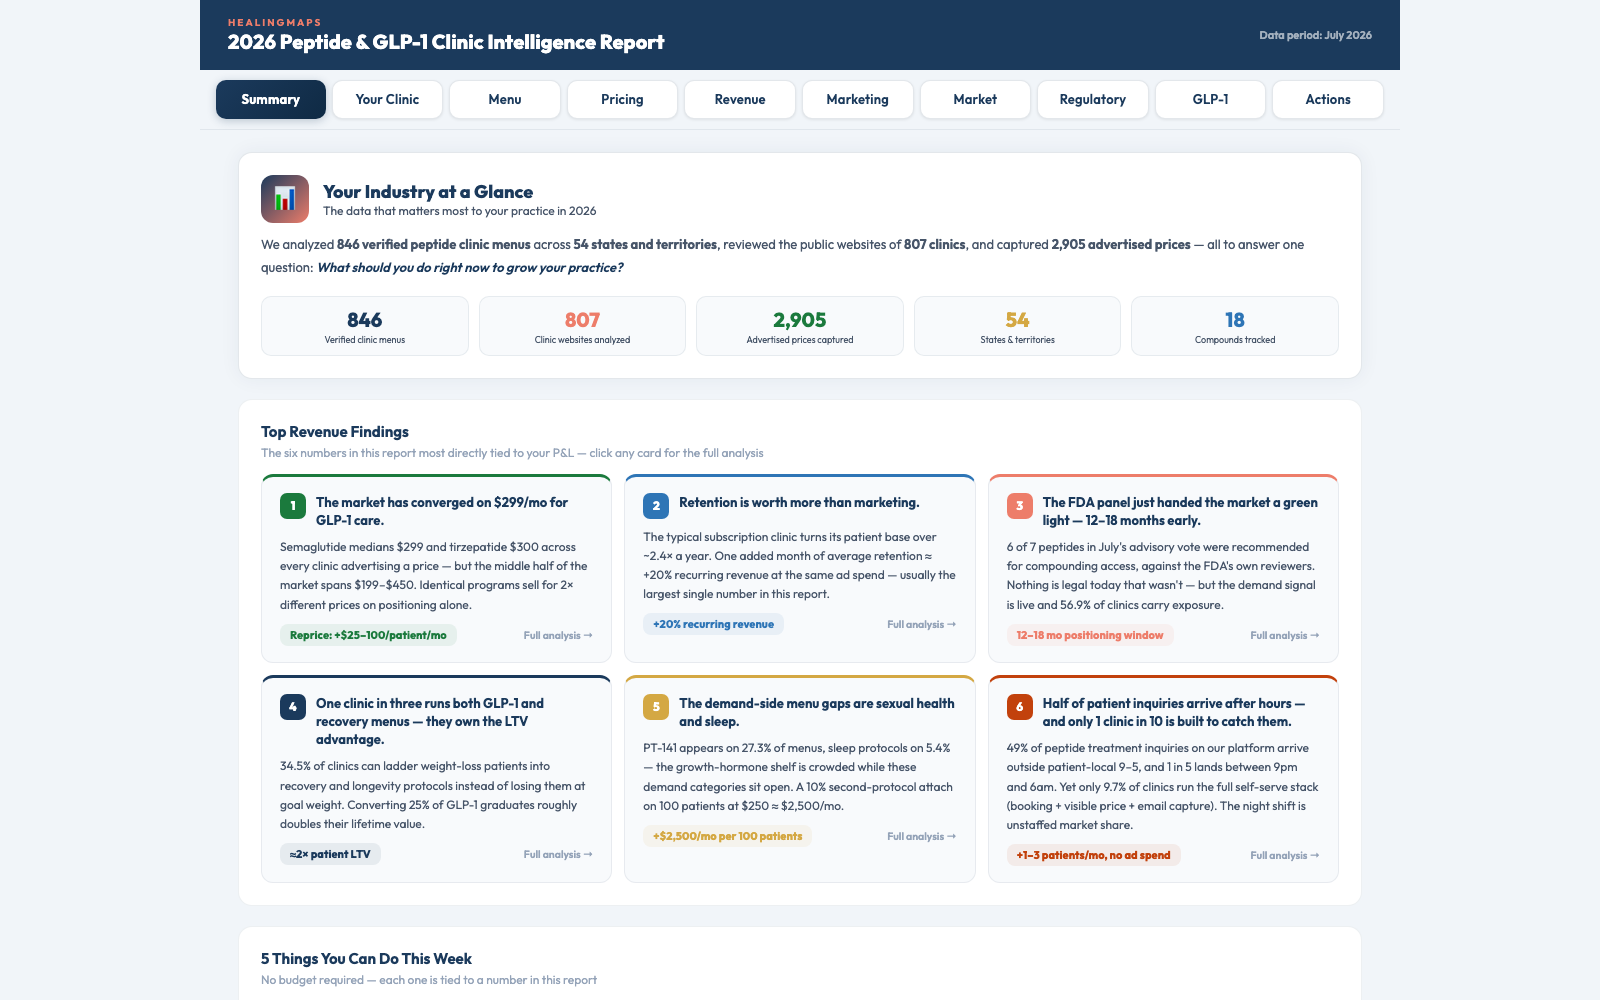
2026 Peptide & GLP-1 Clinic Intelligence Report — Summary tab showing national menu benchmarks and key stats
Scroll continues — plus 9 more sections: Your Clinic, Menu, Pricing, Revenue, Marketing, Market, Regulatory, GLP-1, Actions...
🧬 846 clinic menus decoded, compound by compound
💵 National pricing bands with sample sizes disclosed
📈 Conversion-leak funnel from 807 clinic websites
⚖️ July 2026 FDA vote outcomes mapped to your menu
Get Lifetime Access — $299
Data collected July 2026
Who This Is For

Whether you run an established longevity practice or you're adding your first peptide protocol — this report is the blueprint for building the most profitable peptide program possible.

🏥 Established peptide & longevity clinics

You've built something real — but are you leaving revenue on the table? This report benchmarks your menu, pricing, and marketing against 846 clinics nationwide so you know exactly where your next growth lever is.

💉 Medspas & wellness practices adding peptides

Peptides are the fastest-growing service line in aesthetic and wellness medicine. See which compounds the market actually carries, what they're priced at, and how the best programs are structured — before you build yours.

📊 Clinics scaling a GLP-1 program

GLP-1s changed the economics of weight-management medicine. The dedicated GLP-1 section covers advertised pricing bands, program structures, membership models, and the compliance language regulators are flagging right now.

🚀 Practitioners about to launch

Don't open blind. This report gives you the national menu landscape, real advertised pricing, and a day-one marketing benchmark before you see your first patient — so you start from strength, not guesswork.

Intelligence that changes how you run your practice

The national menu, decoded: BPC-157 leads at 55.3% of clinic menus
Every major compound ranked by how many of the 846 verified clinics carry it — recovery peptides, GLP-1s, growth-hormone secretagogues, NAD+, and more. See instantly which menu gaps are opportunities and which are the market telling you something.
→ Benchmark your own menu in ten minutes
Only 23.9% of clinic websites show a single price
We checked 807 clinic websites signal by signal: pricing pages, online booking, trust badges, blog activity, social presence. The conversion-leak funnel shows exactly where prospective patients fall out — and which fixes cost nothing.
→ Fix the leak before spending more on marketing
Exactly where your pricing stands in the national market
2,905 advertised prices collected across the compounds that matter — semaglutide, tirzepatide, BPC-157, NAD+ and more — presented as percentile bands with sample sizes disclosed. Know whether you're underpriced before your next consult call.
→ Includes an interactive price comparator
57% of clinics carry a compound the FDA just voted on
July 2026's FDA advisory committee votes were the biggest regulatory moment peptide medicine has had. The Regulatory section maps every vote outcome to menu prevalence — so you know exactly how exposed your menu is and what to do about it.
→ Updated with the final July 2026 vote outcomes
What the top-performing clinic websites do differently
Anonymized profiles of the standout clinics for content, social, and conversion — what they publish, how often, and which platforms they've committed to. Plus national benchmarks: how your Instagram, TikTok, and blog cadence compare.
→ Model what's already working, don't guess
47.3% of clinics sell memberships — the recurring-revenue math
The Revenue section builds the model for you: revenue potential per 100 active patients across program structures, eight strategy cards ranked by effort and impact, and the membership math that separates recurring-revenue practices from one-off sellers.
→ Includes an interactive calculator for your own numbers

Everything you need to grow — in one interactive report

This isn't a PDF with charts you'll forget. It's a live, interactive intelligence dashboard you'll return to every month as you make decisions about your menu, pricing, marketing, and compliance.

📊
Executive Summary
Your industry at a glance
The full national picture in one view: key market metrics, the top revenue findings quantified, and the actions to take this week — regardless of where you are in your practice lifecycle.
Top revenue findings, each with a number attached
The state of the market from 846 verified clinic menus
🧮
Your Clinic
Interactive calculator
Enter your own patient counts, pricing, and service mix — the calculator positions your practice against the national benchmarks and shows the revenue impact of each adjustment.
Live benchmarking against national data
Revenue modeling with your own numbers
🧬
Menu Intelligence
846 clinic menus decoded
Which compounds does the market actually carry? Every major peptide ranked by menu prevalence, with category breakdowns across recovery, weight management, longevity, cognitive, and sexual health.
Compound-by-compound prevalence across 846 clinics
The menu gaps that represent real opportunity
💵
Pricing Benchmarks
2,905 advertised prices
National advertised-price bands by compound, percentile by percentile, with sample sizes disclosed on every figure. Plus an interactive comparator to position your own rates instantly.
Percentile bands for semaglutide, tirzepatide, BPC-157, NAD+ and more
Interactive price comparator for your own menu
💰
Revenue Optimization
Program structures · Memberships
Revenue potential per 100 active patients, modeled across program structures — plus eight strategy cards ranked by implementation effort and revenue impact, from membership models to protocol bundling.
Revenue-per-100-patients table across program types
8 revenue strategy cards with the math shown
📈
Digital Marketing
807 websites analyzed
The conversion-leak funnel: where prospective patients fall out between finding a clinic and booking. Content benchmarks, social presence rates, anonymized top-performer profiles, and an AEO playbook for getting cited by AI search.
20+ marketing signals benchmarked across 807 sites
AEO guide: how to show up in AI-generated answers
🗺️
Market Landscape
All 50 states
Where peptide medicine is concentrated and where it's thin: state-by-state clinic distribution, franchise dynamics, and the structural trends shaping where the market goes next.
State-by-state clinic counts and density
The franchise wave and what it means for independents
⚖️
Regulatory Exposure
July 2026 FDA votes mapped
The July 2026 FDA advisory committee outcomes mapped against menu prevalence — how exposed the average clinic menu is, plus the marketing language regulators are flagging versus compliant alternatives.
Vote-outcome-to-menu-prevalence exposure analysis
Flagged vs. compliant GLP-1 marketing language, side by side
💊
GLP-1 Deep Dive
The market's growth engine
A dedicated section on the compounds reshaping practice economics: advertised pricing bands, program and membership structures, and how clinics position GLP-1s alongside their peptide menus.
Semaglutide & tirzepatide advertised-price bands
Program structures and compliance positioning
🚀
Action Plan
Prioritized · Effort-ranked
Everything distilled into eight prioritized action cards — each with the data behind it, the implementation steps, and what it's realistically worth to your practice.
8 data-backed actions, ranked by impact
Start with the ones that cost nothing
HealingMaps
Why our data is different

HealingMaps operates one of the largest verified directories of peptide clinics in the US — 846 clinics, individually verified, across all 50 states.

This report isn't survey guesswork. We went clinic by clinic through every verified menu, collected 2,905 advertised prices from clinics' own websites, and analyzed 807 sites for the marketing and conversion signals that separate the practices growing fastest from everyone else. Every number has a source and a sample size — and it's all July 2026 data, not last year's.

Every number in this report has a source

Not a 50-practitioner survey dressed up as a market study — verified clinic menus, real advertised prices collected from clinics' own websites, and a signal-by-signal marketing crawl. Sample sizes disclosed on every figure.

846
Verified peptide clinic menus analyzed, compound by compound
HealingMaps verified directory · July 2026
2,905
Advertised price observations collected across compounds
Public clinic websites · July 2026
807
Clinic websites analyzed for 20+ marketing & conversion signals
Public web data · July 2026
50
States covered — clinic supply mapped across the entire US market
HealingMaps directory · July 2026
7
FDA advisory-vote compounds tracked, with final July 2026 outcomes mapped to menu prevalence
FDA PCAC meeting · July 23–24, 2026
800+
Clinic social media handles catalogued across Instagram and TikTok
Public web data · July 2026
103
Pages on the median clinic website — plus blog depth and publishing benchmarks for the full set
Site crawl · July 2026
10
Interactive dashboard sections, each with its own data set and action plan
Live browser-based report
A note on how we present pricing:
Advertised prices mix billing units (monthly programs, per-vial, packages), so we present them as directional bands with the sample size disclosed on every figure — never as false precision. Supplemental sources: FDA advisory committee (PCAC) July 2026 meeting outcomes · FDA compounding guidance and enforcement letters · LegitScript certification data · published clinical literature on peptides.

This report pays for itself before lunch on day one

$299 is a rounding error compared to what a single insight is worth. Here's the math across four realistic scenarios.

These are illustrative scenarios based on the advertised-price medians in this report — not guarantees. Your results will vary based on market, volume, and execution.

Scenario 1
One new GLP-1 patient
Median advertised rate × 6 months ~$1,790
Report cost $299
Net after report +$1,491
You need less than one additional patient this year for this report to pay for itself.
Scenario 2
A $25/mo pricing adjustment
+$25/mo × 40 active patients $1,000/mo
Annual impact $12,000/yr
Report pays for itself in ~9 days
The percentile bands show whether a rate move is supported by your market — before you make the call.
Scenario 3
Fixing one conversion leak
+2 bookings/mo from website fixes 2 patients
× ~$275/mo blended program rate $550/mo
Recurring while they stay active $6,600/yr
76% of clinic sites show no prices at all. The funnel analysis shows which missing signals cost you bookings.
Scenario 4
Five patients moved to membership
5 patients × ~$199/mo membership $995/mo
Annual recurring impact $11,940/yr
Report pays for itself in ~9 days
47.3% of clinics already use membership language. The Revenue section shows how the model is structured.

Any one of these scenarios covers the cost of this report many times over.

Most practitioners find two or three applicable to their practice within the first hour of reading.

One investment. Permanent access.

One-time purchase. Everything included.

For context: commissioning a custom market research study from a healthcare consultancy typically runs $5,000–$15,000 and takes 6–8 weeks to deliver. This report gives you purpose-built peptide clinic intelligence — instantly.
One-Time Purchase
$299
Pay once · Permanent lifetime access
10-tab interactive intelligence dashboard
846 verified clinic menus, decoded compound by compound
2,905 advertised prices in national percentile bands
Marketing & conversion benchmarks from 807 clinic sites
July 2026 FDA vote outcomes mapped to menu exposure
GLP-1 pricing, program & compliance deep dive
Revenue models + interactive Your Clinic calculator
Data collected July 2026
Get Lifetime Access — $299 →
🔒 Secure checkout · Card processed by Stripe
What happens after you pay
1 You'll receive a payment confirmation from Stripe.
2 Within 2 hours, HealingMaps will email your personal access code. Check your spam folder if you don't see it.
3 Enter your access code at peptide-clinic-intelligence.netlify.app and explore the full report instantly.
Questions? Email info@healingmaps.com

Common questions

How do I access the report after purchasing?
After completing your purchase, you'll receive an email with your personal access code. The report lives entirely in your browser — nothing to install, no app to download. Works on any device.
Is this a subscription or a one-time purchase?
One-time purchase. You pay $299 once and have permanent access to this edition. When the next edition is released, existing customers receive a discounted upgrade price.
Where does the data come from?
Three primary sources, all collected in July 2026: 846 verified clinic menus from the HealingMaps directory, analyzed compound by compound; 2,905 advertised prices collected from clinics' own public websites; and a signal-by-signal marketing analysis of 807 clinic websites. Regulatory content reflects the final July 2026 FDA advisory committee outcomes. Every figure in the report discloses its source and sample size.
Is this specific to my state or market?
The report is national, with state-level clinic distribution throughout — including which states lead in clinic count and where supply is thin. Pricing and marketing benchmarks are national bands you can position your local rates against.
Is this useful if I already have an established practice?
Yes — often more so. Established practices have the most to gain from benchmarking their pricing against national percentile bands, auditing their website against the conversion-signal checklist, understanding their regulatory exposure after the July 2026 FDA votes, and structuring recurring-revenue membership models. The data shows what the market is doing; you decide where to zag.
What is HealingMaps?
HealingMaps is one of the largest directories of specialty wellness and treatment providers in the US, connecting patients with clinics since 2019. Its verified peptide clinic directory — 846 clinics across all 50 states — is the foundation of this report.
What is the Healing Health Alliance GPO?
The Healing Health Alliance is a national Group Purchasing Organization (GPO) built for independent clinics. Members get access to discounted rates on malpractice insurance, credit card processing, employee benefits, shipping, and practice tools. Joining is free. Learn more →

Stop flying blind. Start with the numbers.

Every month you're operating without this data is a month your competitors might be using it. $299 is about what the median clinic advertises for a single month of one GLP-1 program — and this report pays for itself the first time you use it to position a price, fix a conversion leak, or structure a membership.

Get Lifetime Access — $299

Access delivered within 2 hours · Secure payment

Free for Report Purchasers

Join the Healing Health Alliance GPO

Save on malpractice insurance, credit card processing, shipping, and employee benefits — and access practice tools built for independent clinics. Zero cost to join.

Learn More & Join Free →
Get Access — $299 →